
From information available to us through the Inside Airbnb site and other third-party sources, the data behind Inside Airbnb was sourced by scraping the official Airbnb site, with the intent to analyze, clean, aggregate, and publish this data for public use. The information is presented by city in alphabetical order followed by the last date of data scraping and an option to visualize the data. In each city’s section are downloadable .csv files or compressed .csv.gz files containing listing details, calendar fields, guest reviews, and neighborhood boundaries that can be utilized together in analysis. Conceived in 2015 by creator Murray Cox, an Australian-American community artist and activist, the project provides data and advocacy about Airbnb’s impact on residential communities. In 2023, a nonprofit organization called the Housing Justice Data Lab (HJDL) was founded and has since continued to maintain the Inside Airbnb project alongside Cox and other notable contributors.
Data Cleaning :
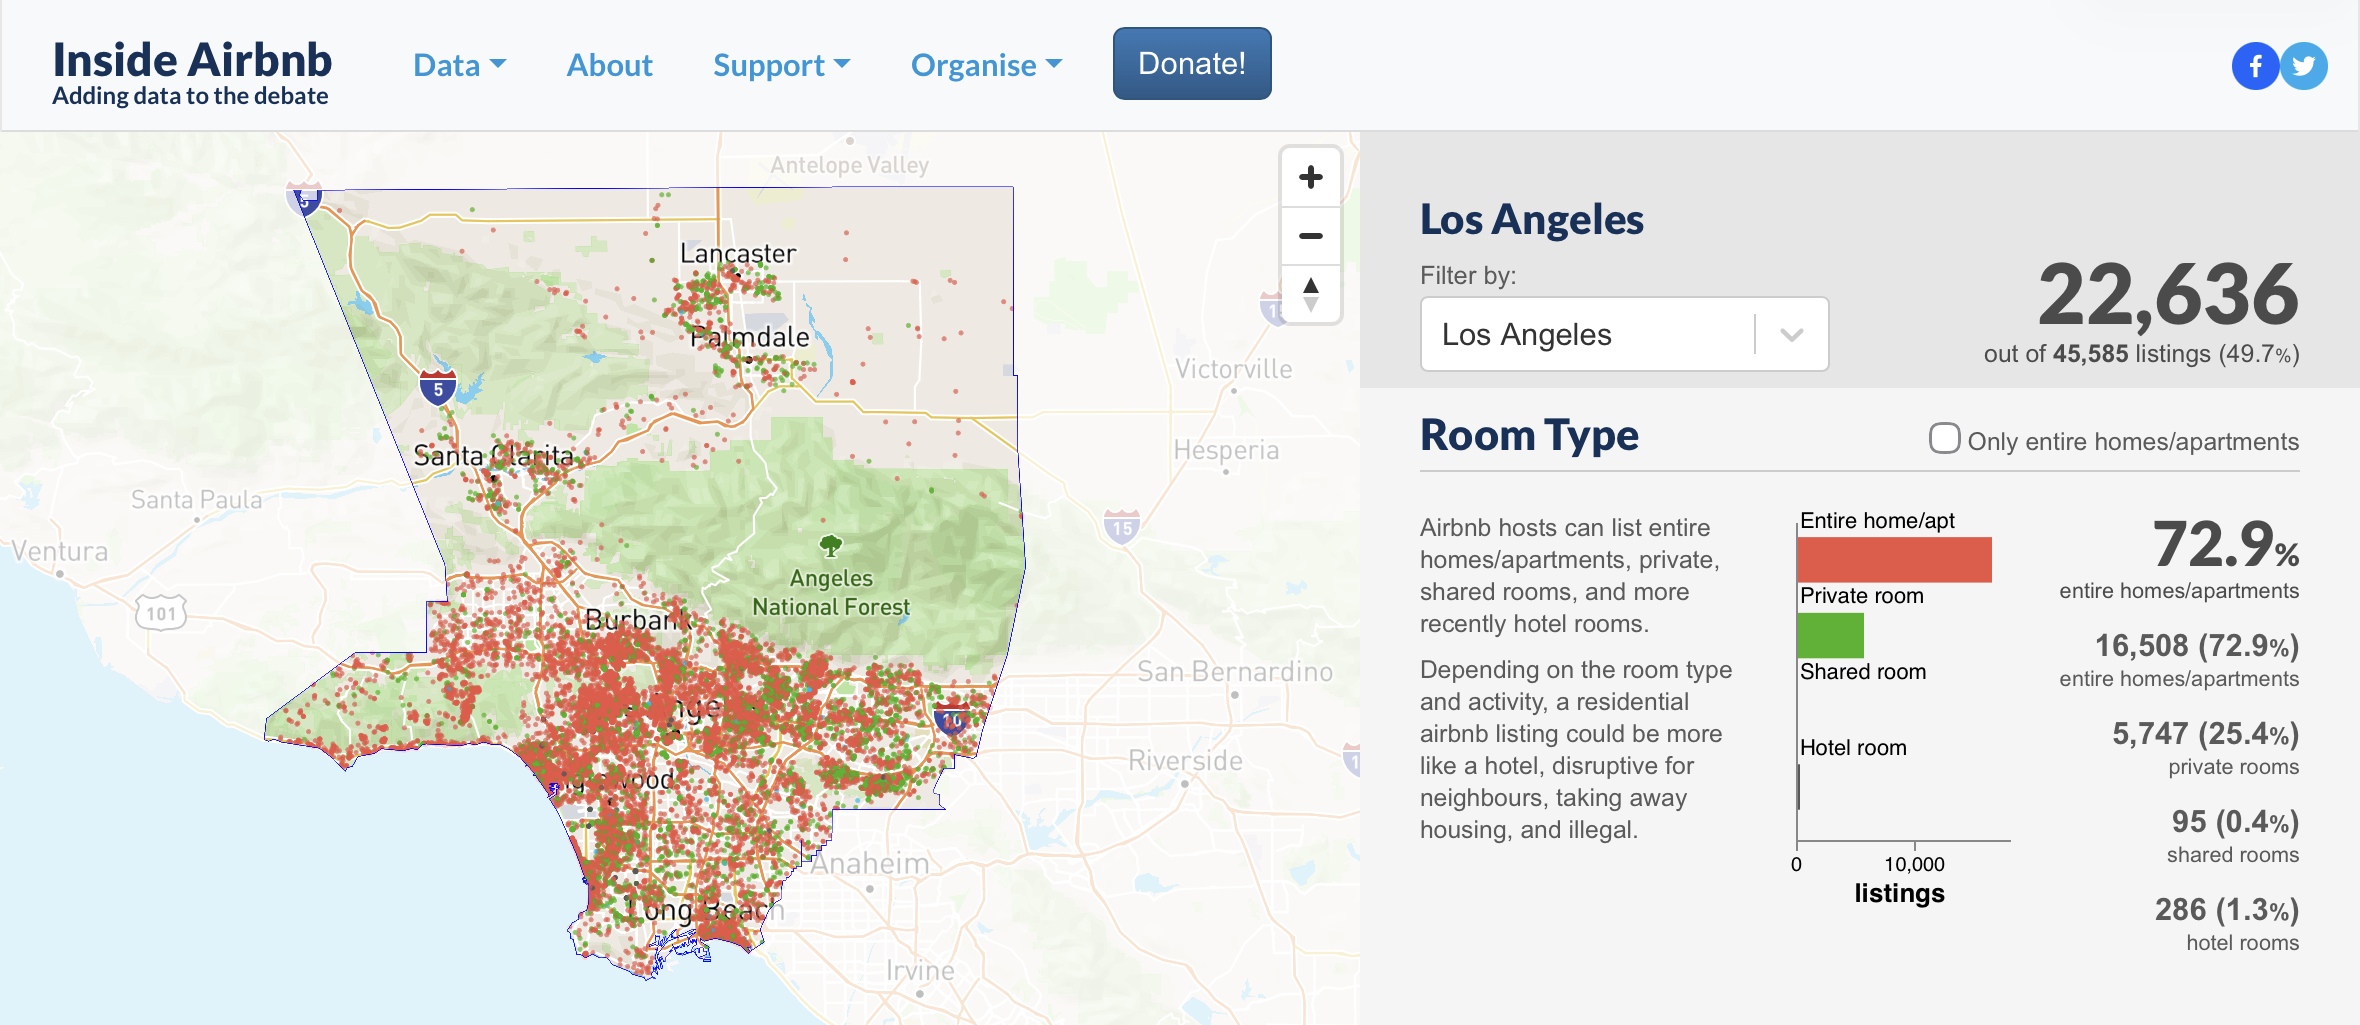
The Inside Airbnb Los Angeles dataset was last scraped, and subsequently updated, on December 4, 2025 and is the archive version we will be referencing throughout our analysis. The datasets are organized by the primary platform objects, with information for each stored in five unique files: listings.csv.gz, calendar.csv.gz, reviews.csv.gz, neighborhoods.csv, and neighborhoods.geojson. For this project, we utilized the singular listings.csv.gz file, which contains information on each individual case of an Airbnb listing in the area. Prior to cleaning, it included 85 columns dedicated to listing-level and host-level details that Airbnb displays publicly such as listing identifiers, host identifiers and attributes, listing description, link, and geographical indicators. Included are additional listing attributes like property type, availability, capacity, minimum and maximum duration, and review-related measures. After cleaning with R, the dataset was drastically reduced to 10 columns that were relevant to producing our map and answering our research question, used concurrently with our second primary source. Additionally, columns were cleaned to change NA values to the default 0.
Data Critique :
With this dataset, we can categorize Airbnb listings into a subdivision county, or CCD, and analyze concentration patterns in Los Angeles County using relevant columns. Using the neighbourhood_cleansed column, we can identify which areas at the neighborhood level contain the highest amount of active listings as well as determine its encompassing CCD. Using latitude and longitude, we create a dot density map to visualize spatial clusters and gradients, as seen here. The room_type column is comprised of two main listing types: entire-homes, which represent the rental of a whole dwelling, and private rooms which represent partial-home rentals. Finally, the reviews_per_month column gives us an idea of guest turnover and activity levels.
Among the five files pertaining to LA County and Airbnb’s in the area, information that would be pertinent in our understanding of the human experience is not included. The files contain no information about guest or resident demographics such as age, race, ethnicity, income, or household size. Additionally, the creator of Inside Airbnb launched this project in an attempt to expose the negative impacts of short-term rentals on residential communities. We encountered an issue with the absence of these variables in the datasets, despite the project’s purpose, as we cannot determine which community profiles align with Airbnb concentrations. As for the listings.csv.gz file, it does not contain cost details and inhibits our ability to analyze the financials of a listing, which would otherwise be the clearest indicator of how housing is an appraised commodity.
Due to the nature of a dataset being only one facet of information to capture a complex system or occurrence, the way information is transformed to be stored as “data” ideologically guides what we acknowledge and what we ignore. The main datasets that are selected to be displayed by Inside Airbnb are (1) listing and host information in listings.csv.gz, (2) listing-by-day records (availability, price, and rules by date) in calendar.csv.gz, (3) guest reviews in reviews.csv.gz, and (4) neighbourhood names and boundaries in neighbourhoods.csv and neighbourhoods.geojson. The ontology establishes an Airbnb listing as the principal unit of how we perceive the world, with all datasets serving as a detailed extension of that unit. Because the dataset centers listings, hosts, and platform-visible signals, it does not include off-platform consequences that have a direct impact on regular people such as increased displacement from unaffordable housing and decreased diversity in communities. If this dataset were our only source, we could determine patterns of Airbnb concentration across Los Angeles County, but we would miss many off-platform effects such as which communities are afflicted and who is ultimately accommodating the tourism.
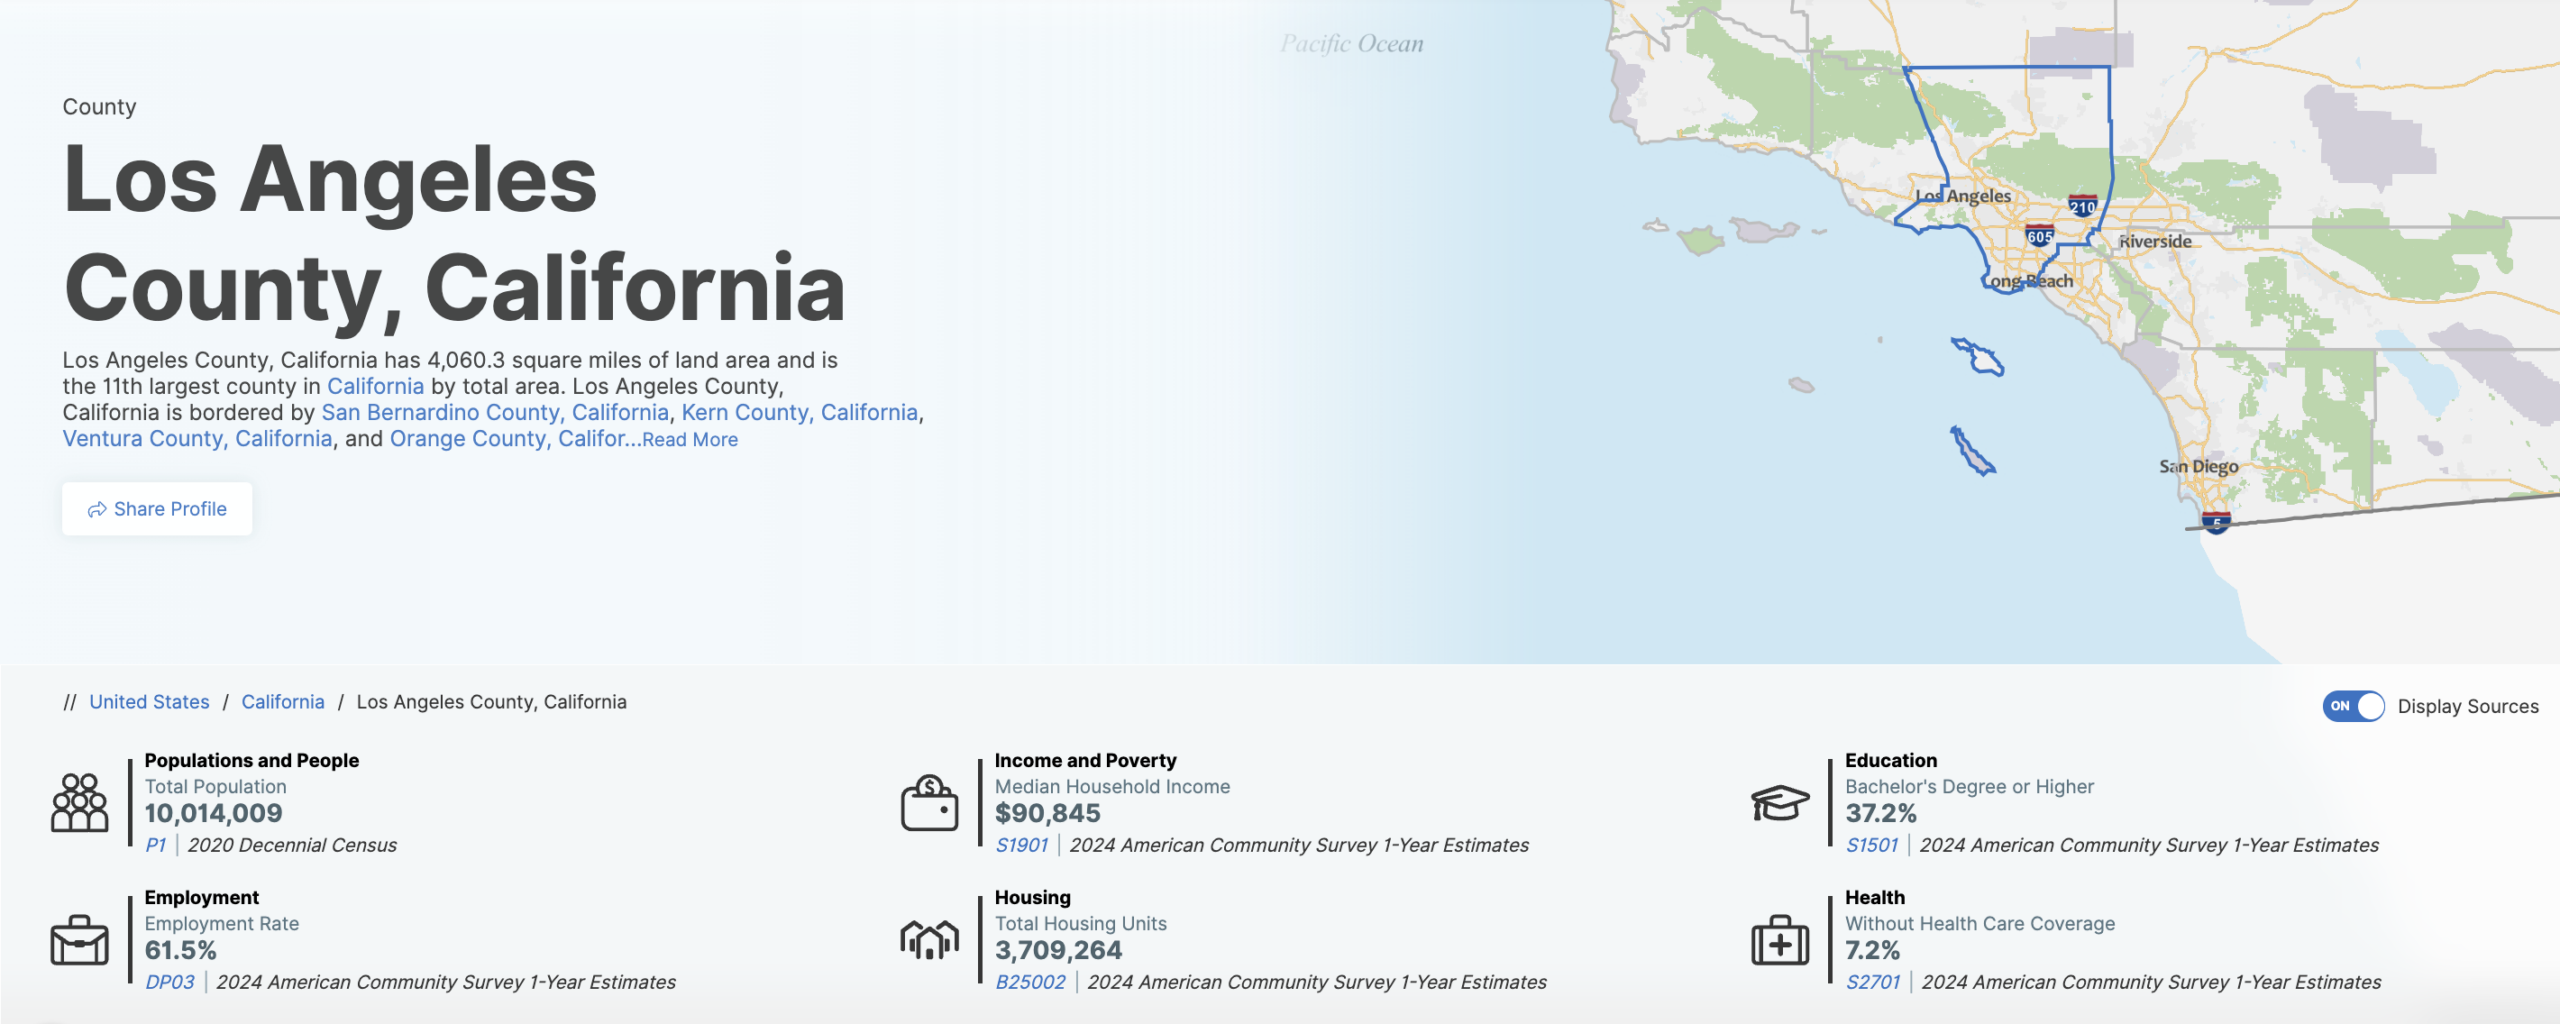
Based on information available through the U.S. Census Bureau and third-party repositories, the provided datasets are products of the American Community Survey (ACS) 5-year estimates. The data is sourced through a continuous nationwide survey conducted by the U.S. Census Bureau, with information collected nearly every day of the year from a sample of approximately 3.5 million addresses annually. Household responses are collected and compiled through mediums such as online, mail, telephone, and in-person interviews. These responses are then pooled over a 60-month period to create the 5-year estimates, which are designed to provide reliable data for geographic areas with varying scales of populations as well as other detailed population characteristics such as racial and ethnic subgroups. The creation of this dataset is funded by the U.S. federal government as part of its constitutional mandate to count the population and these datasets ultimately inform the distribution of over $2.8 trillion in federal funding annually.
Data Cleaning :
The ACS datasets are composed of estimates organized into tables at various geographic levels from state down to ZIP codes and for different types of data. For this project, we use ACS tables at the County Census Division (CCD) level, which offers a meaningful middle ground between the overly broad county level and the overly granular census tract level. Additionally, we selected the tables that would best pertain to our overarching question and finalized the following 3 tables. For tables DP05 and S1901, we extracted estimates and margins of error (MOE) while disregarding the percent estimates and MOE due to redundancy. For table S1501, we extracted only estimates and MOE for race breakdown tabulations and extracted only percent estimates and MOE for poverty status due to lack of tabulation for the latter. Included below are the rows that we have excluded from each table due to the lack of relevance in answering our research question.
I ) DP05 on ACS Demographics and Housing Estimates
Table DP05 provides a detailed breakdown of the population by age, sex, and race, including estimates for specific age brackets such as “under 5 years”, “5 to 9 years”, and in increments up until “85 years and over”. Furthermore, it includes estimates of the population tabulated by one race or combinations of races. Removed rows with R labeled “Race alone or in combination with one or more other races” due to redundancy as it appears in the race tabulations and “CITIZEN, VOTING AGE POPULATION” due to lack of relevance.
I I ) S1901 on Income in the Past 12 Months
Table S1901 covers household income in the past 12 months, providing percent estimates for income brackets from “less than $10,000”, “$10,000 to $14,999”, and continues in increments up to “$150,000 or more”, as well as median and mean income in dollars. Removed rows with R labeled “PERCENT ALLOCATED” due to lack of relevance.
I I I ) S1501 on Educational Attainment
Finally, Table S1501 reports educational attainment for the population by aforementioned race breakdowns in DP05, tabulating estimates of each race by “high school graduate or higher” or “bachelor’s degree or higher”. Furthermore, this table includes percent estimates of poverty status for “less than high school graduate”, “high school graduate (includes equivalency)”, “some college or associate’s degree”, and “bachelor’s degree or higher” categories. Removed rows with R labeled “AGE BY EDUCATIONAL ATTAINMENT” and “MEDIAN EARNINGS IN THE PAST 12 MONTHS (IN 2024 INFLATION-ADJUSTED DOLLARS)” due to lack of relevance. Educational attainment by age does not contribute to our understanding of the communities in the area and inflation-adjusted income convolutes our existing dollar amounts that are not inflation-adjusted.
Data Critique :
With this collection of datasets, we can construct a demographic and socioeconomic profile of a community. We are able to analyze the age and sex distribution of a population as well as its racial and ethnic composition using DP05. With S1901, we can examine the income distribution of communities, identifying areas with severe cost burdens where household incomes are able to afford less compared to their counterparts in surrounding areas. Adding S1501 allows us to explore correlations between educational attainment levels and economic indicators, such as whether areas with higher levels of educational achievement also have higher median incomes or different Airbnb commercialization patterns. We can also compare these characteristics across subdivision counties, observing how a county’s profile differs from that of others.
However, because the ACS is a sample survey, all figures are estimates with associated margins of error (MOE), not exact counts. This means that small differences between two areas or small changes over time may not be statistically significant as they fall within the 95% confidence interval established by the MOE. To protect respondent confidentiality, the ACS aggregated tables also anonymize all individual identifiers and reduce responses to tabulated counts. Furthermore, the datasets do not capture informal economies or the full experience of housing insecurity, such as the number of people doubled up in housing due to cost.
The ideological effect of this dataset’s ontology, or the way it divides the world into discrete categories, is to create a particular visibility that privileges countable, government-defined characteristics. The choice to measure educational attainment by degrees earned reflects an institutional definition of education, ignoring aptitudes learned through vocational training, apprenticeships, or self-study. The racial categories in DP05, while extensive in an attempt to be inclusive, are a product of a long political history and may not be how individuals personally identify. The financial characteristics in S1901 are presented in standardized income brackets that rely on 12-month recall periods and can miss the effects of recent economic changes. If this dataset were our only source, we would see a community neatly categorized by age, race, income levels, and degree attainment, but we would be blind to the effects of short-term rentals on the sustainability of their livelihoods. In this project, these tables are strongest for substantiating the human experience but they cannot, by themselves, substantiate Airbnb’s role in gentrifying and commodifying homes at the community’s expense.
Data Processing :
When we first set out to understand Airbnb’s impact on Los Angeles communities, we needed to contextualize two different kinds of information: the locations of thousands of individual listings and the demographics of the communities hosting them. Inside Airbnb provided us with the listing coordinates across LA and the U.S. Census Bureau’s American Community Survey provided detailed profiles of local populations. To put into perspective why we approached the datasets in the manner that we did, the Inside Airbnb listings span across 266 distinct neighborhoods. On the contrary, the Census data operated at an ideal scale, dividing the county into 20 CCDs. To address this, we created a custom mapping code program that assigned each of the 266 neighborhoods to its encompassing CCD, ensuring every listing in our final dataset was assigned a CCD and connected to the Census data. From cleaning and combining the datasets with R, in R Studio, we were able to finalize the dataset we would use for our map and visualizations in Tableau.
Word Count:
Read Time: